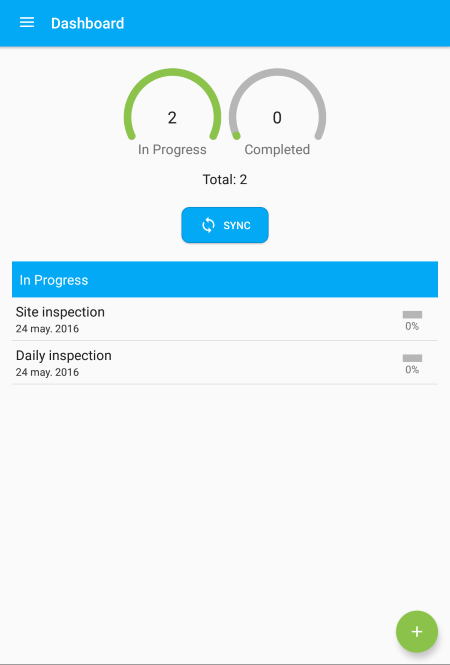
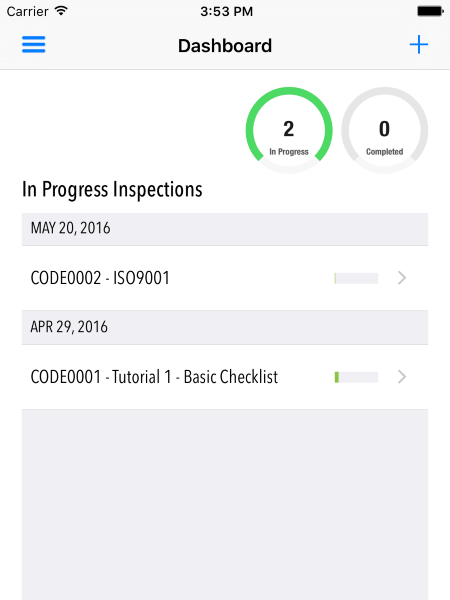
The dashboard view is the home page or first view when the the App opens. It is divided in two diferent sections or areas. The upper side contains some graphical information and the lower side contains the list of currently in progress inspections you are working on.

Area Description
Upper Side
Element Comments
Gauge - In Progress This graph shows the current number of In Progress inspections.
Cauge - Completed This graph shows the number of all Completed inspections.
Total In Android devices, this indicator shows the whole number of inspections in the device. It includes all three inspections' status: open, completed and rejected.
Android This button runs the synchronization process to upload/download inspections when working with Plinius Inspections. Plinius Users

Lower Side This shows the list of the current in progress inspections. Tap on a row to enter and work with the inspection. Swiping left or right on each row will show additional actions you can execute within the inspections.

Element Comments
Inspection List This is the list of the current inspections you are working on. The list is sorted by date. Additionally it is grouped by date iOS
Android

iOS
This button allows you to create new inspections. It is located in the lower right side of the screen for Android or in the upper bar for iOS,
Android Swiping right the row to get a PDF report.
Android Swiping right the row to lock the inspection, setting it as completed.
Swiping left the row to delete the inspection.

Template List
Android

Template List